
Quick Summary (Key Takeaways)
• The hyper-visibility trap: The rampant increase in dashboards in building operations creates a false sense of control, causing visual overload and cognitive fatigue for facility teams.
• The context bottleneck: Data capture in buildings has already been solved by sensors and BMS. The current challenge is correlating scattered information (HVAC, energy, occupancy) to generate a systemic understanding.
• Intelligence beyond visualization: Traditional tools merely show past events. Building operational intelligence anticipates scenarios, explains root causes, and suggests decisions.
• Automated interpretation: The future of building efficiency relies on systems that reduce repetitive manual analysis, translating raw data into practical maintenance actions.
• The Greenole approach: A focus on absolute clarity, eliminating visual noise to transform automation data into contextual intelligence, preventing operational impacts before failures occur.
There is a silent belief dominating facility management and building automation: the idea that having more dashboards means having more control. In practice, the exact opposite is true.
Modern building operations have never had access to so many charts, KPIs, alerts, and real-time screens. Yet, even with this technological abundance, maintenance teams continue to react late, investigate the wrong causes, and make decisions based solely on superficial symptoms. The result is a growing distance from truly understanding the building.
This scenario reflects an excess of visualization devoid of applied intelligence, creating a new form of operational blindness.
The Era of Hyper-Visibility and Overload in Building Automation
In recent years, building infrastructure has been massively digitized. Modern systems integrate BMS (Building Management Systems), HVAC controls, lighting, ESG platforms, energy meters, and IoT devices. Every new technological layer brought the promise of greater clarity, but ultimately resulted in an explosion of dashboards.
Today, it is common to find fragmented panels separated by floor, by system (water, energy, AC), or by vendor. Despite this robust structure, facility managers still struggle with fundamental questions. They wonder about the root cause of an energy spike, whether a deviation in thermal comfort is isolated or systemic, and what the cross-impact between different equipment might be. Simply visualizing data does not guarantee a real understanding of the building’s operation.
The Gap Between Visual Observation and Analytical Intelligence
A traditional dashboard’s primary function is to show past events or display current status. In contrast, building operational intelligence is analytical and predictive: it explains why things happen, maps out the influences between environmental variables, assesses direct operational impacts, forecasts scenarios, and recommends the ideal corrective actions.
A smart corporate building or shopping mall might monitor thousands of control points simultaneously (temperature, air quality, occupancy, water flow) and still maintain a purely reactive stance. This happens because the technical team remains overwhelmed, forced to mentally connect isolated alarms to the overall behavior of the building.
The human brain has natural limits when it comes to correlating hundreds of variables under pressure, yet many management systems are still designed under the assumption of this limitless capacity.
The Illusion of Control and the Contextualization Challenge
Hyper-visibility generates a dangerous psychological effect: multiple screens transmit a false sense of mastery over processes. Teams end up just watching metrics and putting out fires. The ecosystem becomes highly observable, yet poorly understood.
An automation control room filled with glowing panels might project an image of technological sophistication, but it frequently masks serious problems, such as a lack of systemic interpretation and cognitive fatigue among operators. This environment makes prioritizing maintenance difficult and creates excessive reliance on veteran professionals.
Digital transformation has already solved the building data capture problem. The major current challenge for facility management lies in intelligently contextualizing this scattered data.
The Future of Buildings: From Interfaces to Actionable Understanding
Current systems have already mastered the art of measuring and alerting. The next evolutionary step demands platforms capable of interpreting correlations, understanding the dynamic behavior of the building, identifying cross-impacts (e.g., how occupancy affects the HVAC load), and contextualizing maintenance decisions. Without this intelligence, professionals are trapped in a cycle of slow responses and energy inefficiency.
Mature organizations have realized that the definitive technological leap involves reducing the need for repetitive human interpretation. The strategy shifts from merely adding graphic interfaces to transforming building behavior into actionable understanding. The future belongs to architectures that automatically correlate variables, identify root causes, and actively support decision-making.
Less Visual Noise, More Action with Greenole’s BOS
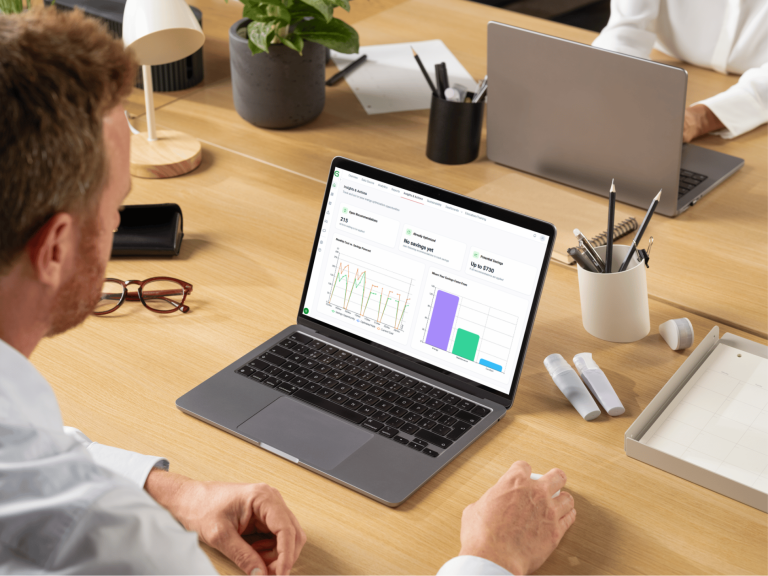
Truly intelligent building operations depend less on non-stop human observation in front of monitors and more on high-level automated interpretation. The ideal environment reduces unnecessary screens, disconnected KPIs, and “alarm floods,” prioritizing context and applied intelligence. The risk for data-driven developments is becoming hostage to interfaces devoid of strategic meaning.
In this context, Greenole acts as a true BOS (Building Operating System). Far beyond a simple monitoring dashboard, our platform unifies all the scattered systems in your building (from legacy BMS and HVAC to lighting and IoT sensors) with a deep layer of systemic intelligence. We guarantee absolute clarity for corporate environments, eliminating the paralyzing visual noise that overwhelms facility teams.
Our core goal is to transform the sea of isolated data into contextual intelligence and, above all, into practical, targeted actions. Greenole’s BOS doesn’t just reveal invisible relationships and real energy impacts; it tells you exactly what needs to be done based on the continuous analysis of this data.
True efficiency is born from the ability to unify the building’s entire machinery, deeply understand its behavior, and execute precise corrections before any failure or waste even occurs.
FAQ: Frequently Asked Questions About Building Operational Intelligence
What is hyper-visibility in building operations? It is a common scenario in facility management characterized by an abundance of data, sensors, and monitoring screens (BMS/IoT), but with low analytical interpretation capacity. It results in overwhelmed teams reacting only to alarms and isolated symptoms, without grasping the building’s overall context.
What is the difference between traditional dashboards and operational intelligence? A dashboard displays metrics, history, and status alerts. Operational intelligence goes further by automatically correlating these variables, explaining the root causes of fluctuations (such as temperature anomalies or energy spikes), predicting scenarios, and supporting decision-making focused on comfort and cost reduction.
How does information overload affect facility management? The availability of thousands of uncorrelated indicators demands extreme mental effort from the maintenance team. This abundance of disconnected data causes cognitive fatigue, delays incident response, and makes prioritizing work orders difficult, keeping the building’s operation permanently in reactive mode.
How do you achieve maturity in building automation? The transition requires moving from a model focused purely on data capture to an architecture driven by understanding. Smart buildings need systems capable of automating the interpretation of the infrastructure’s dynamic behavior, freeing up teams to focus on strategic decisions, energy efficiency, and failure anticipation.